2026a
# cdf
累积分布函数
函数库: TyStatistics
# 语法
# 说明
y = cdf(pd,x) 基于 x 中的值计算并返回概率分布对象 pd 的 cdf。示例
# 示例
使用分布对象计算正态分布 cdf
创建一个正态分布对象,并使用该对象计算正态分布的 cdf 值。
创建均值 μ 等于 1、标准差 σ 等于 5 的正态分布对象。
using TyStatistics
mu = 1
sigma = 5
pd = Normal(mu,sigma)
定义输入向量 x 以包含用于计算 cdf 的值。
x = [-2,-1,0,1,2]
基于 x 中的值计算正态分布的 cdf 值。
y = cdf.(pd,x)
5-element Vector{Float64}:
 0.2742531177500736
 0.3445782583896758
 0.42074029056089696
 0.5
 0.579259709439103
y 中的每个值对应于输入向量 x 中的一个值。例如,在值 x 等于 1 时,对应的 cdf 值 y 等于 0.5000。
计算泊松分布 cdf
创建一个泊松分布对象,使用的速率参数 λ 等于 2。
using TyStatistics
lambda = 2
pd = Poisson(lambda)
定义输入向量 x 以包含用于计算 cdf 的值。
x = [0,1,2,3,4]
基于 x 中的值计算泊松分布的 cdf 值。
y = cdf(pd,x)
5-element Vector{Float64}:
 0.1353352832366127
 0.4060058497098381
 0.6766764161830634
 0.8571234604985469
 0.9473469826562889
y 中的每个值对应于输入向量 x 中的一个值。例如,在值 x 等于 3 时,对应的 cdf 值 y 等于 0.8571。
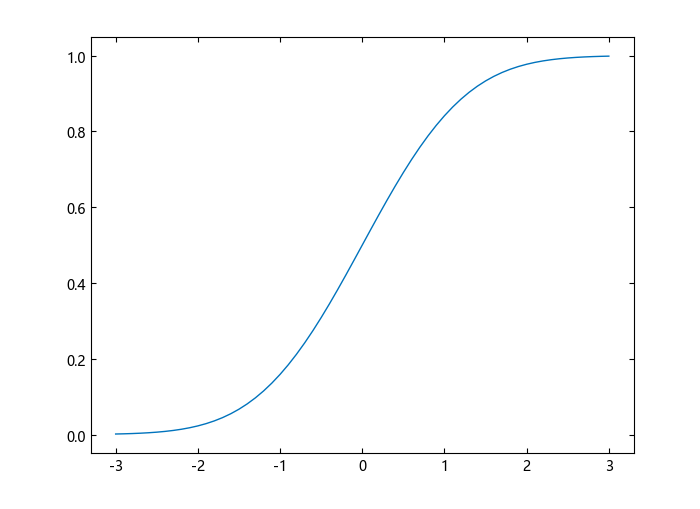
绘制标准正态分布 cdf
创建一个标准正态分布对象。
using TyPlot
using TyStatistics
pd = Normal()
pd = Normal{Float64}(μ=0.0, σ=1.0)
指定 x 值并计算 cdf。
x = -3:.1:3
p = cdf.(pd,x)
绘制标准正态分布的 cdf。
plot(x,p)
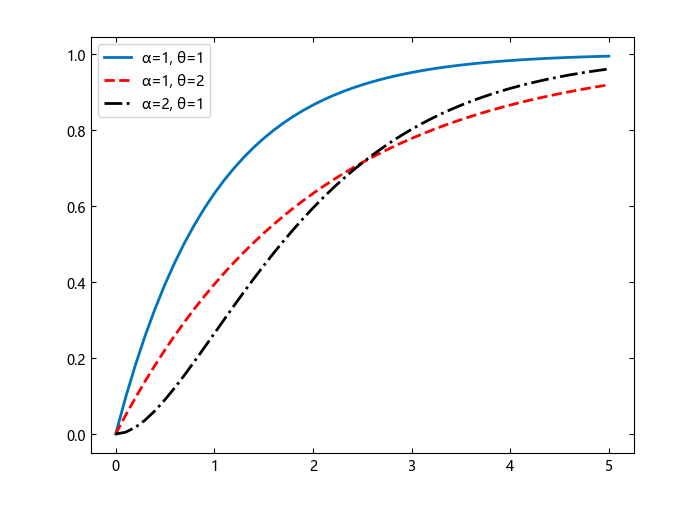
绘制 Gamma 分布 cdf
创建三个 gamma 分布对象。第一个使用默认参数值。第二个指定 a = 1 和 b = 2。第三个指定 a = 2 和 b = 1。
using TyPlot
using TyStatistics
pd_gamma = Gamma()
Gamma{Float64}(α=1.0, θ=1.0)
pd_12 = Gamma(1,2)
Gamma{Float64}(α=1.0, θ=2.0)
pd_21 = Gamma(2,1)
Gamma{Float64}(α=2.0, θ=1.0)
指定 x 值,并计算每个分布的 cdf。
x = 0:.1:5;
cdf_gamma = cdf(pd_gamma,x);
cdf_12 = cdf(pd_12,x);
cdf_21 = cdf(pd_21,x);
创建一个绘图,该绘图用于可视化在为形状参数 a 和 b 指定不同值时 gamma 分布的 cdf 如何变化。
figure()
J = plot(x,cdf_gamma,label="α=1, θ=1",linewidth=2)
hold("on")
K = plot(x,cdf_12,"r--",label="α=1, θ=2",linewidth=2)
L = plot(x,cdf_21,"k-.",label="α=2, θ=1",linewidth=2)
legend()
hold("off")
对 t 分布进行帕累托尾拟合,并计算 cdf
对累积概率为 0.1 和 0.9 的
using TyStatistics
using TyMath
rng = MT19937ar(5489)
t = trnd(rng,3,100,1);
obj = paretotails(t,0.1,0.9);
p,q = boundary(obj)
p = 2-element Vector{Float64}:
 0.1
 0.9

q = 2-element Vector{Float64}:
 -1.8487450853802965
  2.0766157032060515
基于 q 中的值计算 cdf。
cdf(obj,q)
ans = 2-element Vector{Float64}:
 0.1
 0.9
# 输入参数
x - 计算 cdf 的值
标量值 |标量值数组
用于计算 cdf 的值,指定为标量值或标量值组成的数组。
如果输入参数 x、A、B、C 和 D 中的一个或多个是数组,则数组大小必须相同。在这种情况下,cdf 将每个标量输入扩展为与数组输入大小相同的常量数组。
示例:[0.1,0.25,0.5,0.75,0.9]
pd - 概率分布
概率分布对象
概率分布,指定为下表中的概率分布对象之一。
# 输出参数
y - cdf 值
标量值 | 标量值数组
cdf 值,以标量值或标量值组成的数组形式返回。在经过任何必要的标量扩展后,y 的大小与 x 相同。y 中的每个元素均为由分布参数(A、B、C 和 D)中的对应元素或概率分布对象 (pd) 指定的分布的 cdf 值,其值在 x 中的对应元素处进行计算。