2026b
# tightlayout
调整间距
函数库: TyPlot
# 语法
tightlayout()
tightlayout(fig)
# 说明
tightlayout()为当前图窗布局的自动调整功能,用于自动调整 Syslab 图窗中的子图边距和布局,以确保它们适合图形。主要用于 Syslab 绘图的布局优化。示例
tightlayout(fig)设置指定图窗的布局自动调整功能,用于自动调整 Syslab 图窗中的子图边距和布局,以确保它们适合图形。主要用于 Syslab 绘图的布局优化。示例
# 示例
调整当前图窗
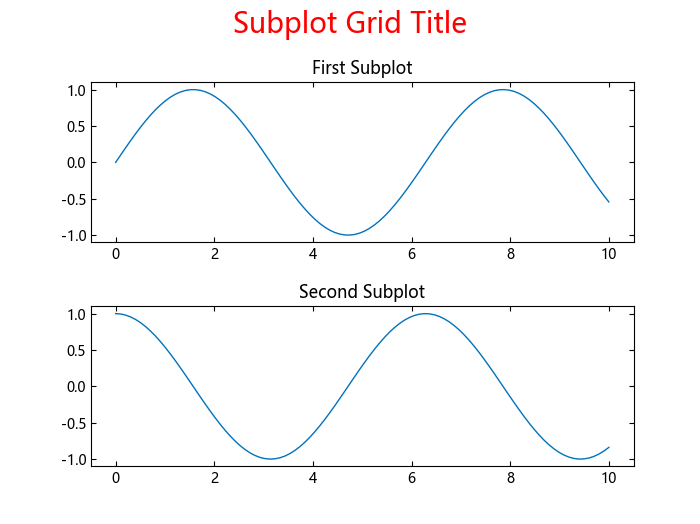
创建带有两个堆叠子图的图窗,在子图网格上添加标题。调整当前图窗间距。
using TyPlot

subplot(2, 1, 1)
x = LinRange(0, 10, 100);
y1 = sin.(x);
plot(x, y1)
title("First Subplot")
subplot(2, 1, 2)
y1 = cos.(x);
plot(x, y1)
title("Second Subplot")

sgt = sgtitle("Subplot Grid Title"; color="red");
sgt.set_fontsize(20)

tightlayout()
调整指定图窗
创建一个分为四个子图的图窗。在每个子图上绘制一条正弦波并为每个子图指定标题。调整指定图窗布局。
using TyPlot
fig = figure()
subplot(2, 2, 1)
x = LinRange(0, 10, 100);
y1 = sin.(x);
plot(x, y1)
title("Subplot 1: sin(x)")

subplot(2, 2, 2)
y2 = sin.(2 * x);
plot(x, y2)
title("Subplot 2: sin(2x)")

subplot(2, 2, 3)
y3 = sin.(4 * x);
plot(x, y3)
title("Subplot 3: sin(4x)")

subplot(2, 2, 4)
y4 = sin.(8 * x);
plot(x, y4)
title("Subplot 4: sin(8x)")

tightlayout(fig)

# 输入参数
fig - 图窗图窗对象
要调整布局的图窗,指定为图窗对象。