2026a
# interpolate
插值
函数库: TyMath
# 语法
itp = interpolate(A, interpmode)
itp = interpolate((nodes1, nodes2, ...), A, interpmode)
# 说明
itp = interpolate(A, interpmode) 对数组 A 使用插值方法 interpmode 进行插值。 示例
itp = interpolate((nodes1, nodes2, ...), A, interpmode) 返回对节点 nodes 以及节点对应值 A 采用插值方法 interpmode 的插值函数。 示例
# 示例
一维插值
创建平面坐标系内散点。
using TyMath
using TyPlot
using Interpolations
y = [19.21 , 18.15 , 15.36 , 18.10 , 16.89 , 11.32 , 7.45 , 5.24 , 7.01]
采用分段线性插值并绘图。
itp = interpolate(y,BSpline(Linear()))
xq = 1:0.1:9 # 插值数据
hold("on")
plot(xq,itp.(xq))
plot(1:9,y,"o",markeredgecolor = "k",markerfacecolor = "#FFFF00")
title("分段线性插值")
xlabel("xdata")
ylabel("value")
hold("off")

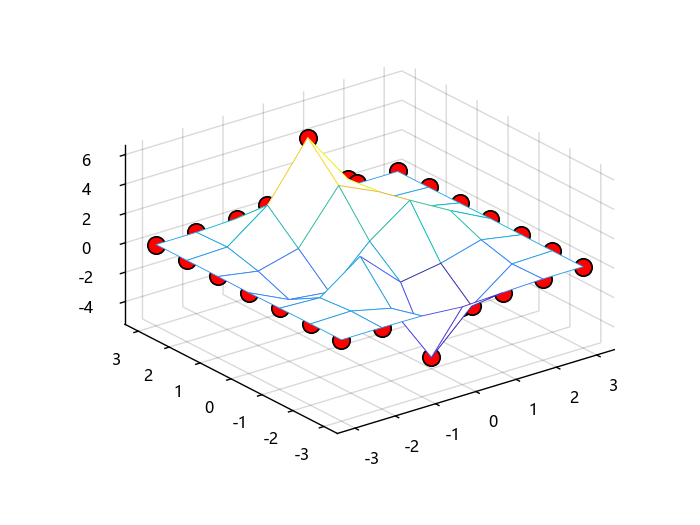
二维插值
构造初始数据点并绘制原始数据图。
using TyMath
using TyBase
using TyPlot
using Interpolations
f_in(x,y) = 3*(1-x)^2*exp(-(x^2) - (y+1)^2) - 10*(x/5 - x^3 - y^5)*exp(-x^2-y^2) - 1/3*exp(-(x+1)^2 - y^2)
x = -3:1:3
y = -3:1:3
X,Y = ndgrid(x,y)
Z = f_in.(X,Y)
mesh(X,Y,Z)
hold("on")
plot3(X,Y,Z,"o",markersize = 10,markeredgecolor = "k",markerfacecolor = "r")
grid("on")
hold("off")
采用最邻近插值并绘制图。
itp = interpolate((x,y),Z,Gridded(Constant()))
xt = -3:0.1:3
yt = xt
Xt,Yt = meshgrid2(xt,yt)
surf(Xt,Yt,itp.(Xt,Yt))

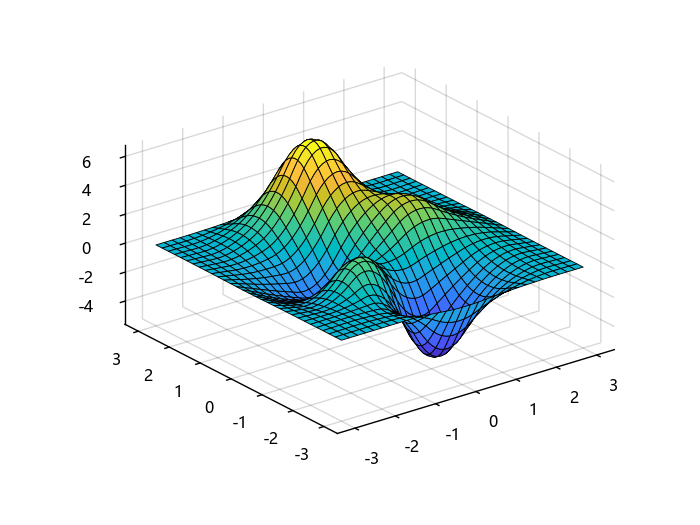
采用三次样条插值并绘图。
itp = interpolate(Z,BSpline(Quadratic(Line(OnCell()))))
sitp = Interpolations.scale(itp, x, y)
xt = -3:0.1:3
yt = xt
Xt,Yt = meshgrid2(xt,yt)
surf(Xt,Yt,sitp.(Xt,Yt))
四维插值
构造初始数据点。
using TyMath
using TyBase
using Interpolations
f(x,y,z,t) = t * exp( -x^2 - y^2 - z^2)
xx = yy = zz = -1:.2:1
tt = 0:2:10
x,y,z,t = ndgrid(xx,yy,zz,tt)
V = f.(x,y,z,t)
对原始数据进行插值,并得到插值函数 sitp。
itp = interpolate(V,BSpline(Cubic(Line(OnGrid()))))
sitp = Interpolations.scale(itp,xx,yy,zz,tt)
对点 (x,y,z,t) = (-1,-0.5,0.2,4) 处进行求值。
sitp(-1,-0.5,0.2,4)
ans = 1.1012212045782097
# 输入参数
nodes - 插值节点
原始数据点的网格向量(自变量)。
数据类型: Int | Float
A - 函数值
网格节点对应函数值(因变量)。
数据类型: Int | Float
复数支持: 是
interpmode - 插值方法
对于 interpolate(A, interpmode):
interpmode 可为 NoInterp() 、BSpline(Constant()) 、BSpline(Linear()) 、 BSpline(Quadratic(bc)) 、 BSpline(Cubic(bc))
其中 bc 为边界条件 :
- Throw():只对原数据范围内数据进行插值;
- Flat():外插部分设置斜率为 0;
- Linear():采用恒定斜率进行外插;
- Reflect():反射边界条件;
- Periodic():周期性边界条件。
对于 interpolate((nodes1, nodes2, ...), A, interpmode) :
interpmode 仅有三种方法 : Gridded(Linear())、 Gridded(Constant())、 NoInterp()
# 输出参数
itp - 插值函数
根据原有数据进行插值后得到的插值函数,输入自变量可得到对应插值结果。
示例: itp[1]
数据类型: Struct