# excludedata
从拟合中排除数据
函数库: TyCurveFitting
# 语法
tf = excludedata(x,y,"box",box)
tf = excludedata(x,y,"domain",domain)
tf = excludedata(x,y,"range",range)
tf = excludedata(x,y,"indices",indices)
# 说明
tf = excludedata(x,y,"box",box) 返回一个逻辑值向量,表示哪个元素在由 box 指定的 xy 平面的矩形区域以外。tf 取 1 的位置的点在区域内,取 0 的点在区域外。为了在使用 fit 拟合曲线时排除数据,将 tf 指定为 "exclude_data"。示例
tf = excludedata(x,y,"domain",domain) 区分其 x 值在区间 domain 以外的点。示例
tf = excludedata(x,y,"range",range 区分其 y 值在区间 range 以外的点。示例
tf = excludedata(x,y,"indices",indices) 区分指标与 indices 相同的点。
# 示例
可视化排除规则
使用随机数据可视化排除规则。
生成随机的 x,y 数据。
using TyPlot
using TyCurveFitting
using TyMath
rng = MersenneTwister(1234)
xdata = @. -3 + 6 * $rand(rng,Int(1e4))
ydata = @. -3 + 6 * $rand(rng,Int(1e4))
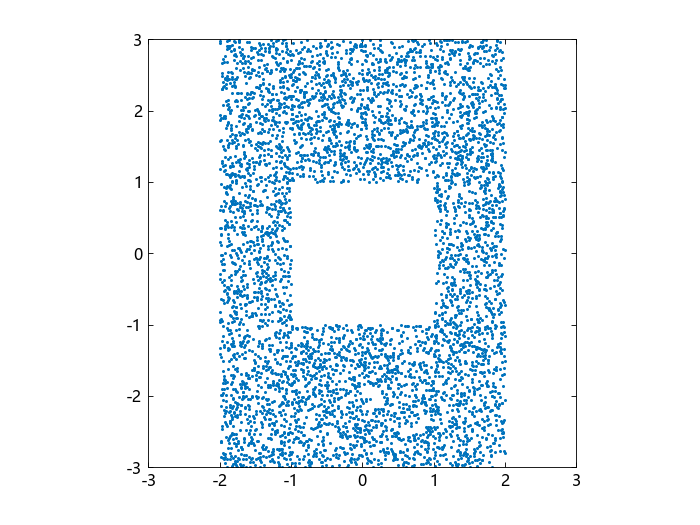
作为一个示例,排除在 [-1 1 -1 1] box 区域以内的点与 [-2 2] domain 以外的点。
outliers1 = .!excludedata(xdata,ydata,"box",[-1 1 -1 1])
outliers2 = excludedata(xdata, ydata, "domain",[-2 2])
outliers = outliers1 .| outliers2
绘制不被排除的数据。白色区域就是被排除的。
plot(xdata[.!outliers],ydata[.!outliers],".")
axis([-3 3 -3 3])
axis("square")
从曲线拟合中排除数据
读取 2000 年美国大选时弗罗里达州各县的投票数据。
using TyPlot
using TyCurveFitting
using TyBase
include(pkgdir(TyCurveFitting) * "/examples/docs/flvote2k.jl")
使用两大主要党派代表布什与戈尔的计票数据来预测第三方党派代表布坎南的计票数据,然后绘制为散点图。
plot(bush,buchanan,"rs")
hold("on")
plot(gore,buchanan,"bo")
legend(["Bush data","Gore data"])

假设固定比例的布什或戈尔的选民会投给布坎南。
f = fittype(["x"])
Linear model:
y(a,x) = a*x
排除来自没有使用具有争议的“蝴蝶票”的缺席选民的数据。
nobutterfly = strcmp.(counties,"Absentee Ballots")
为排除了缺席选民数据的两个数据集采取双平方权稳健拟合。
bushfit = fit(f,bush,buchanan,exclude=nobutterfly,robust="bisquare")
gorefit = fit(f,gore,buchanan,exclude=nobutterfly,robust="bisquare")
稳健拟合给予极端值更小的权重,因此来自于稳健拟合的大残差数据可以用来识别极端值。
figure()
plotfit(bushfit,bush,buchanan,"rs","residuals")
hold("on")
plotfit(gorefit,gore,buchanan,"bo","residuals")

计算残差。
bushres = buchanan - fvallm(bushfit,bush)
goreres = buchanan - fvallm(gorefit,gore)
认为在 rang [-500 500] 以外的数据为大残差数据。
bushoutliers = excludedata(bush,bushres,"range",[-500 500])
goreoutliers = excludedata(gore, goreres,"range",[-500 500])
展示具有极端值的县。Miami-Dade 与 Broward 县具有最大的自变量值。Palm Beach 县,也就是整个州唯一使用“蝴蝶票”的县既有最大的残差值。
counties[bushoutliers]
ans = 2-element Vector{String}:

 "Miami-Dade"
 "Palm Beach"
counties[goreoutliers]
ans = 3-element Vector{String}:

 "Broward"
 "Miami-Dade"
 "Palm Beach"
# 输入参数
x - 数据位点向量
数据值的数据位点,指定为向量。
y - 数据值向量
数据值,指定为向量。
box - 用来判断数据点是否在其以外的矩形区域有四个元素的向量或矩阵
用来判断数据点是否在其以外的矩形区域,指定为由四个元素组成的矩阵 [xmin, xmax, ymin, ymax]。
示例:[-1 1 0 2]
domain - 用来判断数据位点是否在其以外的区间有两个元素的向量或矩阵
用来判断数据点是否在其以外的矩形区域,指定为由两个元素组成的矩阵 [xmin, xmax]。
示例:[3 4]
range - 用来判断数据值是否在其以外的区间有两个元素的向量或矩阵
用来判断数据值是否在其以外的区间,指定为由两个元素组成的矩阵 [ymin, ymax]。
示例:[3, 4]
indices - 排除数据点的指标向量 | 矩阵
排除数据点的指标,指定为向量。
示例:[3 7 9]
# 输出参数
tf - 排除后的数据向量
数据值的数据位点,指定为向量。