# 光伏发电最大功率点跟踪系统
本文使用 TYPhotovoltaicPower 光伏发电模型库进行拖拽建模,创建光伏发电最大功率点跟踪系统,展示光伏发电模型库的示例。
# 案例介绍
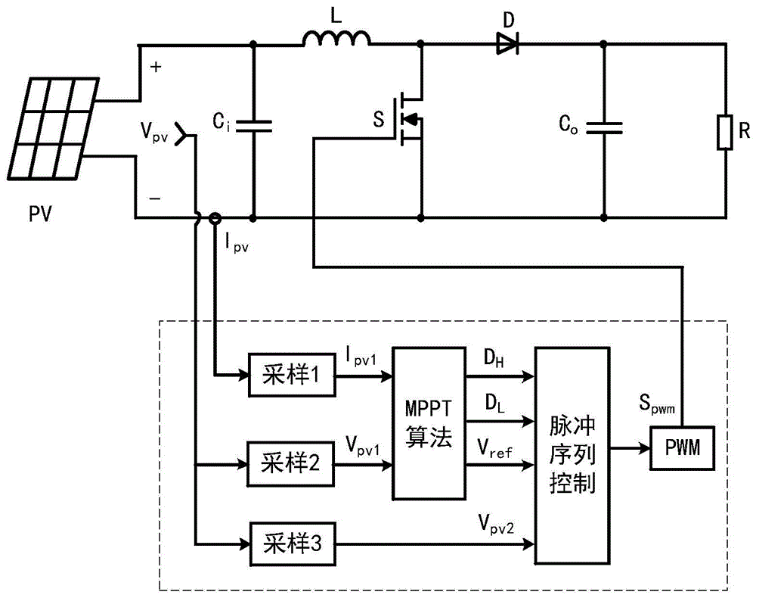
以光伏发电最大功率点跟踪系统为例,在 0~5 秒内仿真,光照强度输入在 2.5 s 从 1000 w/m2 增加到 1200 w/m2,光伏发电系统的电流电压和功率同步提高,实现光伏发电跟踪功能。
# 相关组件
经过模型分析后,光伏发电最大功率点跟踪系统中对应的模型组件如下表所示:
| 模型名称 | 模型英文名称 | 模型路径 |
|---|---|---|
 太阳能电池 太阳能电池 | PVArray | TYPhotovoltaicPower.Generators.PVArray |
 电阻 电阻 | Resistor | TYPhotovoltaicPower.Components.Resistor |
 电容 电容 | Capacitor | TYPhotovoltaicPower.Components.Capacitor |
 电感 电感 | Inductor | TYPhotovoltaicPower.Components.Inductor |
 升压斩波 升压斩波 | Boost | TYPhotovoltaicPower.PowerConverters.IdealSwitching.Boost |
 电压源 电压源 | Voltage | TYPhotovoltaicPower.Sources.ElectricalSources.Voltage |
 温度边界 温度边界 | TemperatureSource | TYPhotovoltaicPower.Sources.HeatSources.TemperatureSource |
 单位延迟模块 单位延迟模块 | UnitDelay | Modelica.Blocks.Discrete.UnitDelay |
 MPPT 控制器 MPPT 控制器 | MPPT | TYPhotovoltaicPower.Controllers.MPPT |
 电压调节器 电压调节器 | VrefRegulator | TYPhotovoltaicPower.Controllers.VrefRegulator |
 电流传感器 电流传感器 | CurrentSensor | TYPhotovoltaicPower.Sensors.ElectricalSensors.CurrentSensor |
 电压传感器 电压传感器 | VoltageSensor | TYPhotovoltaicPower.Sensors.ElectricalSensors.VoltageSensor |
 功率 功率 | Power | Modelica.Blocks.Math.Product |
 接地 接地 | Ground | TYPhotovoltaicPower.Sources.ElectricalSources.Ground |
 生成实数类型的阶跃信号 生成实数类型的阶跃信号 | Step | Modelica.Blocks.Sources.Step |
# 物理模型
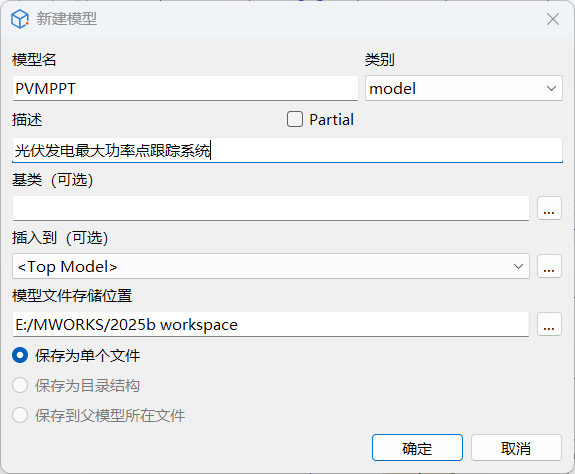
进入文件 > 新建 Modelica 模型 > model…。
在新建模型面板中,填写模型名为
PVMPPT,描述为光伏发电最大功率点跟踪系统。选择模型文件存储位置后,单击确定,完成模型创建。
拖拽相关组件,完成模型选择和连接。
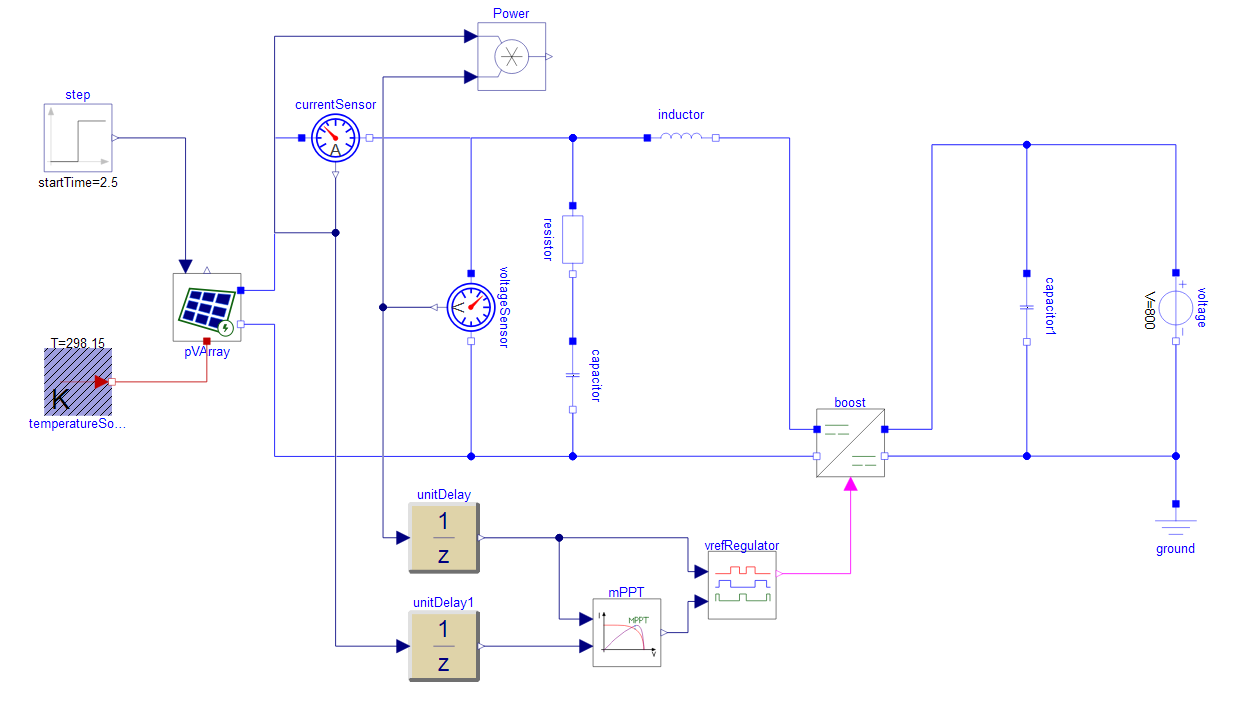
根据系统数据,相关模型的参数设置如下表所示,未给出的参数保持默认值。
以下相关参数的表格:
| 组件 | 路径 | 参数 | 数值 | 单位 |
|---|---|---|---|---|
| step | Modelica.Blocks.Sources.Step | offset | 1000 | / |
| step | Modelica.Blocks.Sources.Step | startTime | 2.5 | s |
| step | Modelica.Blocks.Sources.Step | height | 200 | / |
| resistor | TYPhotovoltaicPower.Components.Resistor | R | 0.001 | Ω |
| capacitor | TYPhotovoltaicPower.Components.Capacitor | C | 0.01 | F |
| capacitor | TYPhotovoltaicPower.Components.Capacitor | v_c.start | 296 | V |
| inductor | TYPhotovoltaicPower.Components.Inductor | L | 0.0016 | H |
| capacitor1 | TYPhotovoltaicPower.Components.Capacitor | C | 0.001 | F |
| capacitor1 | TYPhotovoltaicPower.Components.Capacitor | v_c.start | 800 | V |
| pvArray | TYPhotovoltaicPower.Generators.PVArray | Ns | 10 | / |
| pvArray | TYPhotovoltaicPower.Generators.PVArray | Np | 47 | / |
| pvArray | TYPhotovoltaicPower.Generators.PVArray | N_user | 1 | / |
| voltage | TYPhotovoltaicPower.Sources.ElectricalSources.Voltage | V_constant | 800 | V |
| unitDelay | Modelica.Blocks.Discrete.UnitDelay | samplePeriod | 5e-5 | s |
| unitDelay1 | Modelica.Blocks.Discrete.UnitDelay | samplePeriod | 5e-5 | s |
| mPPT | TYPhotovoltaicPower.Controllers.MPPT | MPPTSelect | "扰动观察法" | / |
| mPPT | TYPhotovoltaicPower.Controllers.MPPT | Vrefinit | 296 | V |
| mPPT | TYPhotovoltaicPower.Controllers.MPPT | f_sample | 1/5e-5 | Hz |
| mPPT | TYPhotovoltaicPower.Controllers.MPPT | deltaVref | 0.0001 | V |
| vrefRegulator | TYPhotovoltaicPower.Controllers.VrefRegulator | k | 10 | / |
| vrefRegulator | TYPhotovoltaicPower.Controllers.VrefRegulator | rising | 1e-5 | s |
| vrefRegulator | TYPhotovoltaicPower.Controllers.VrefRegulator | width | 0 | s |
| vrefRegulator | TYPhotovoltaicPower.Controllers.VrefRegulator | falling | 1e-5 | s |
| vrefRegulator | TYPhotovoltaicPower.Controllers.VrefRegulator | period | 2e-5 | s |
| TemperatureSource | TYPhotovoltaicPower.Sources.HeatSources.TemperatureSource | T | 25 | degC |
# 结果分析
针对该案例,单击仿真,结果曲线如下所示:
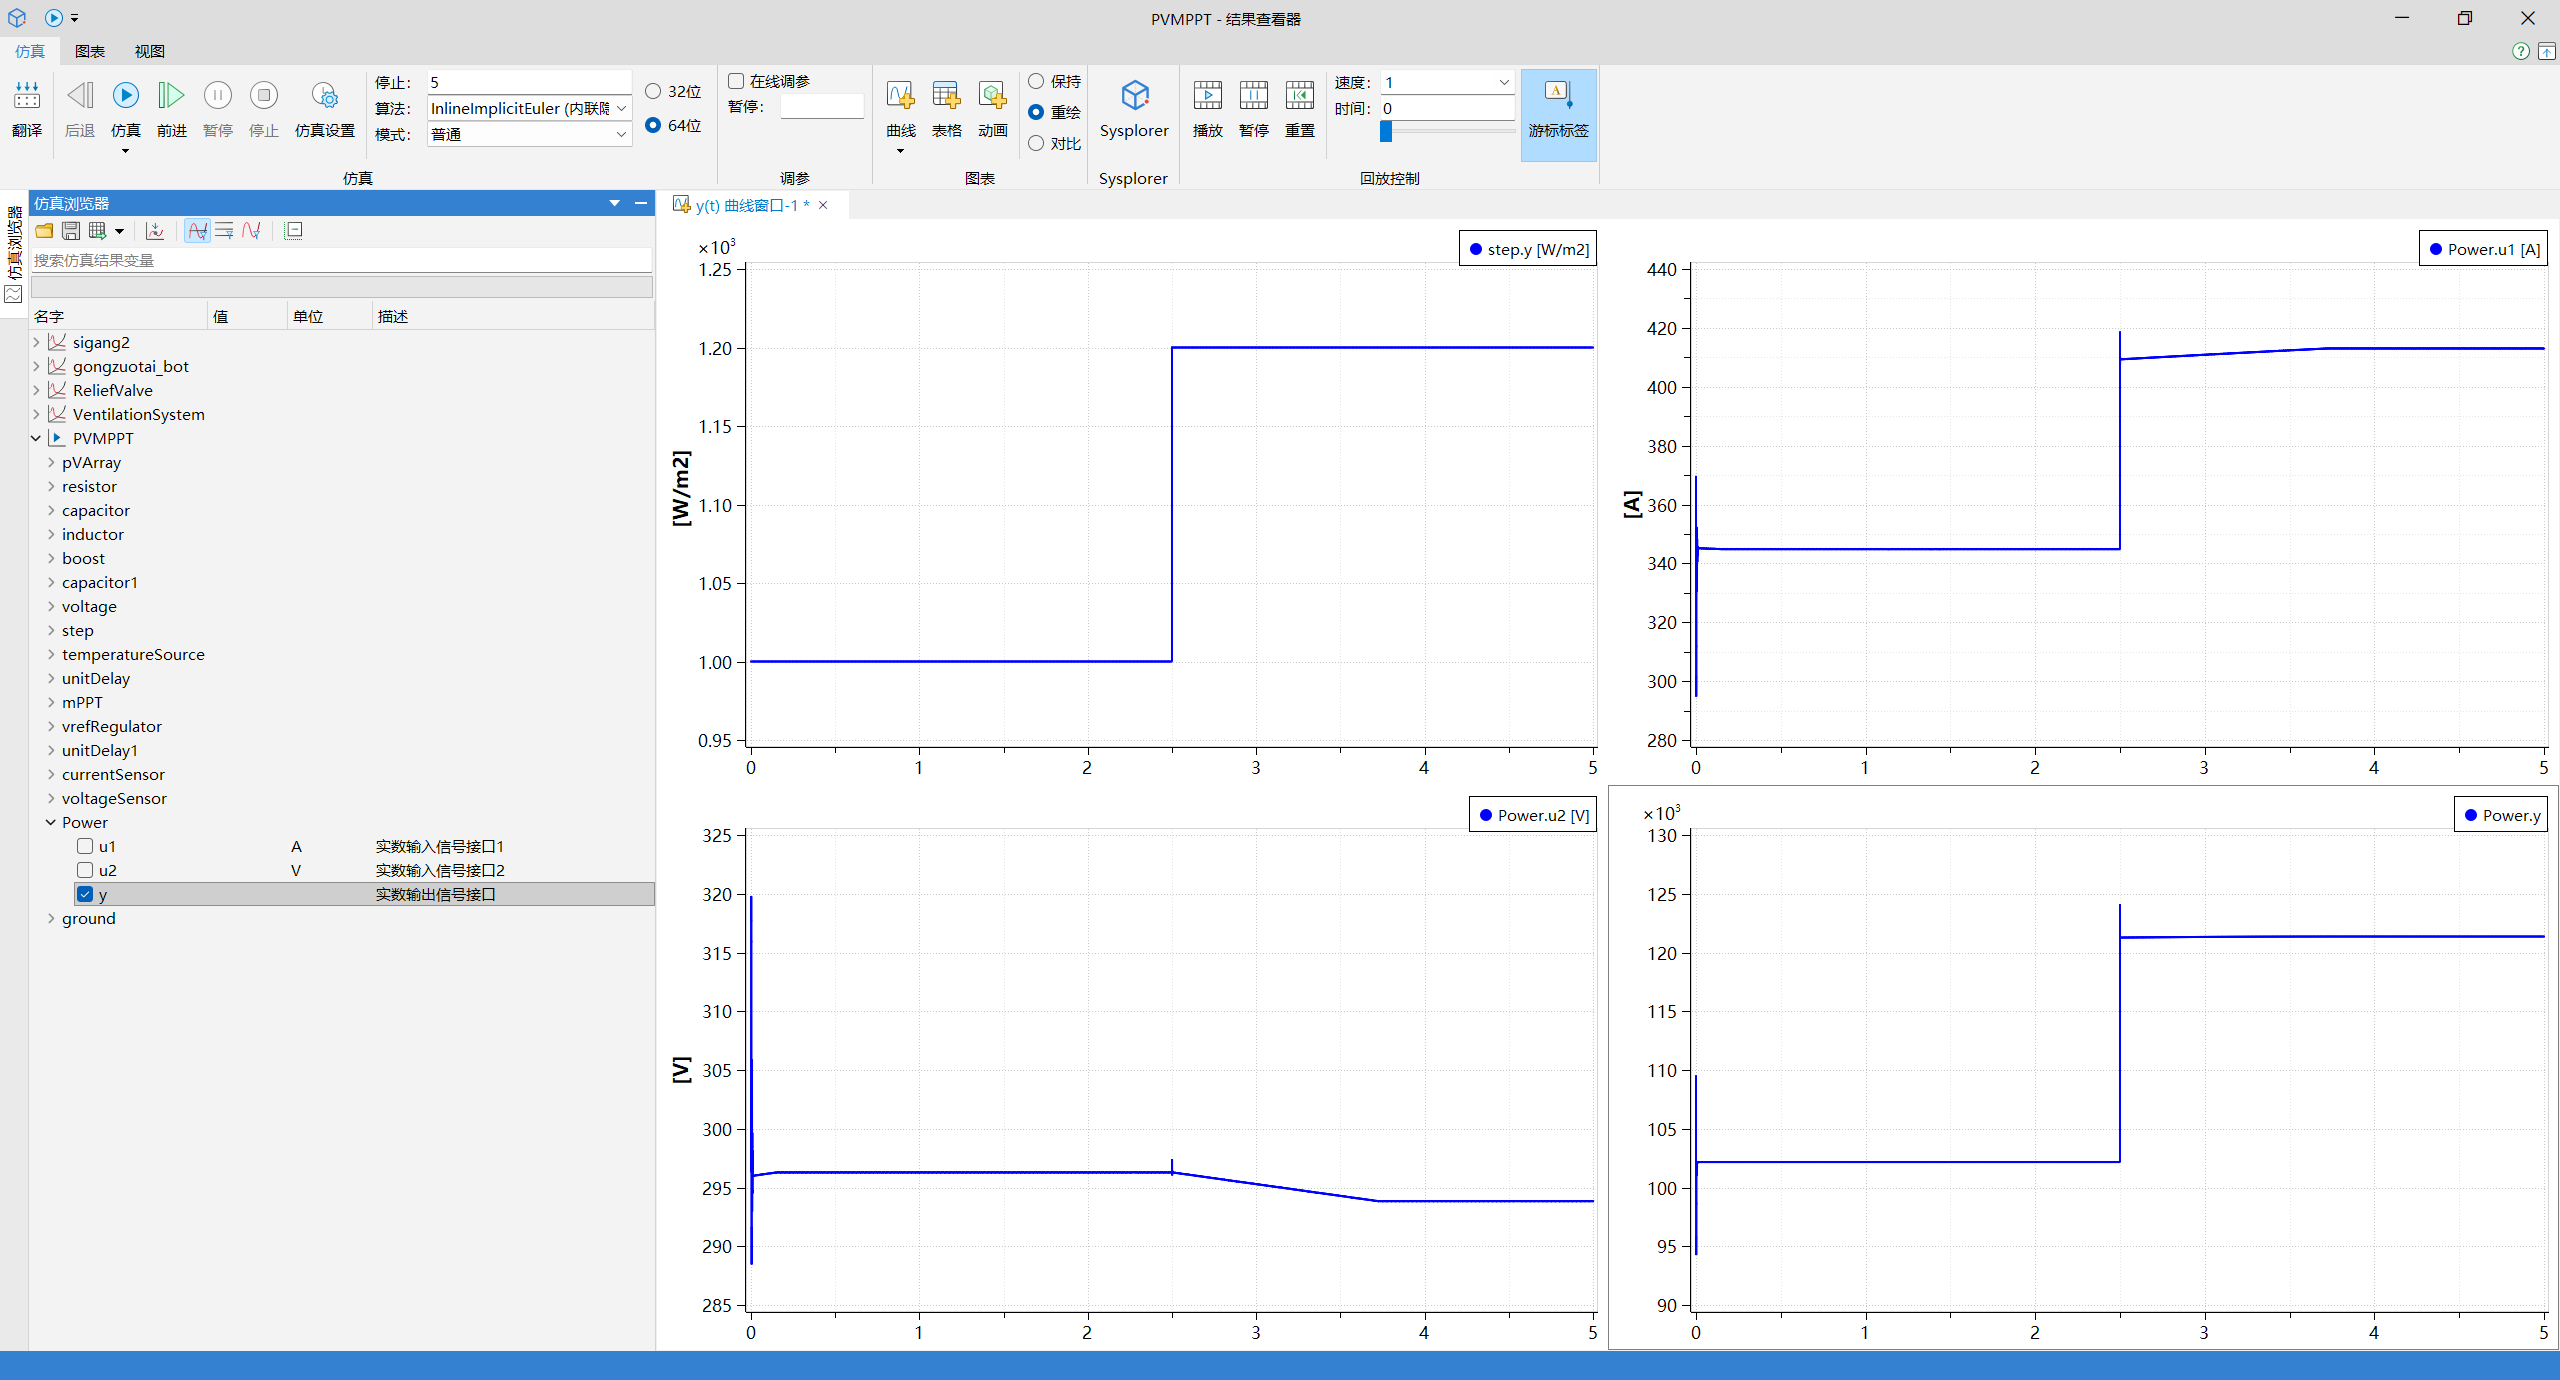
从仿真结果可以看出,当光照强度输入在 2.5 s 从 1000 w/m2 增加到 1200 w/m2时,光伏发电系统的电流电压和功率同步提高,实现光伏发电跟踪功能。
提示
- 建模前请学习 Modelica 简介的相关内容。
- 更多模型使用技巧请参考光伏发电模型库帮助文档。